Image Similarity Score
Let me tell you something, the real world is not like:
import tensorflow_datasets as tfds
dataset = tfds.load('kitti')
You have to put in some real science and engineering skills to create a useful, high-quality dataset. Just take a look at this talk from Andrej Karpathy, where he explains Tesla’s approach to training dataset creation.
Andrej Karpathy - AI for Full-Self Driving
To help you select the best samples from your raw data, we created the similarity scorer tool. It gives you a metric, how diverse your dataset is. There is also a clustering option, which enables you to select the most beneficial data to annotate quickly.
Goals
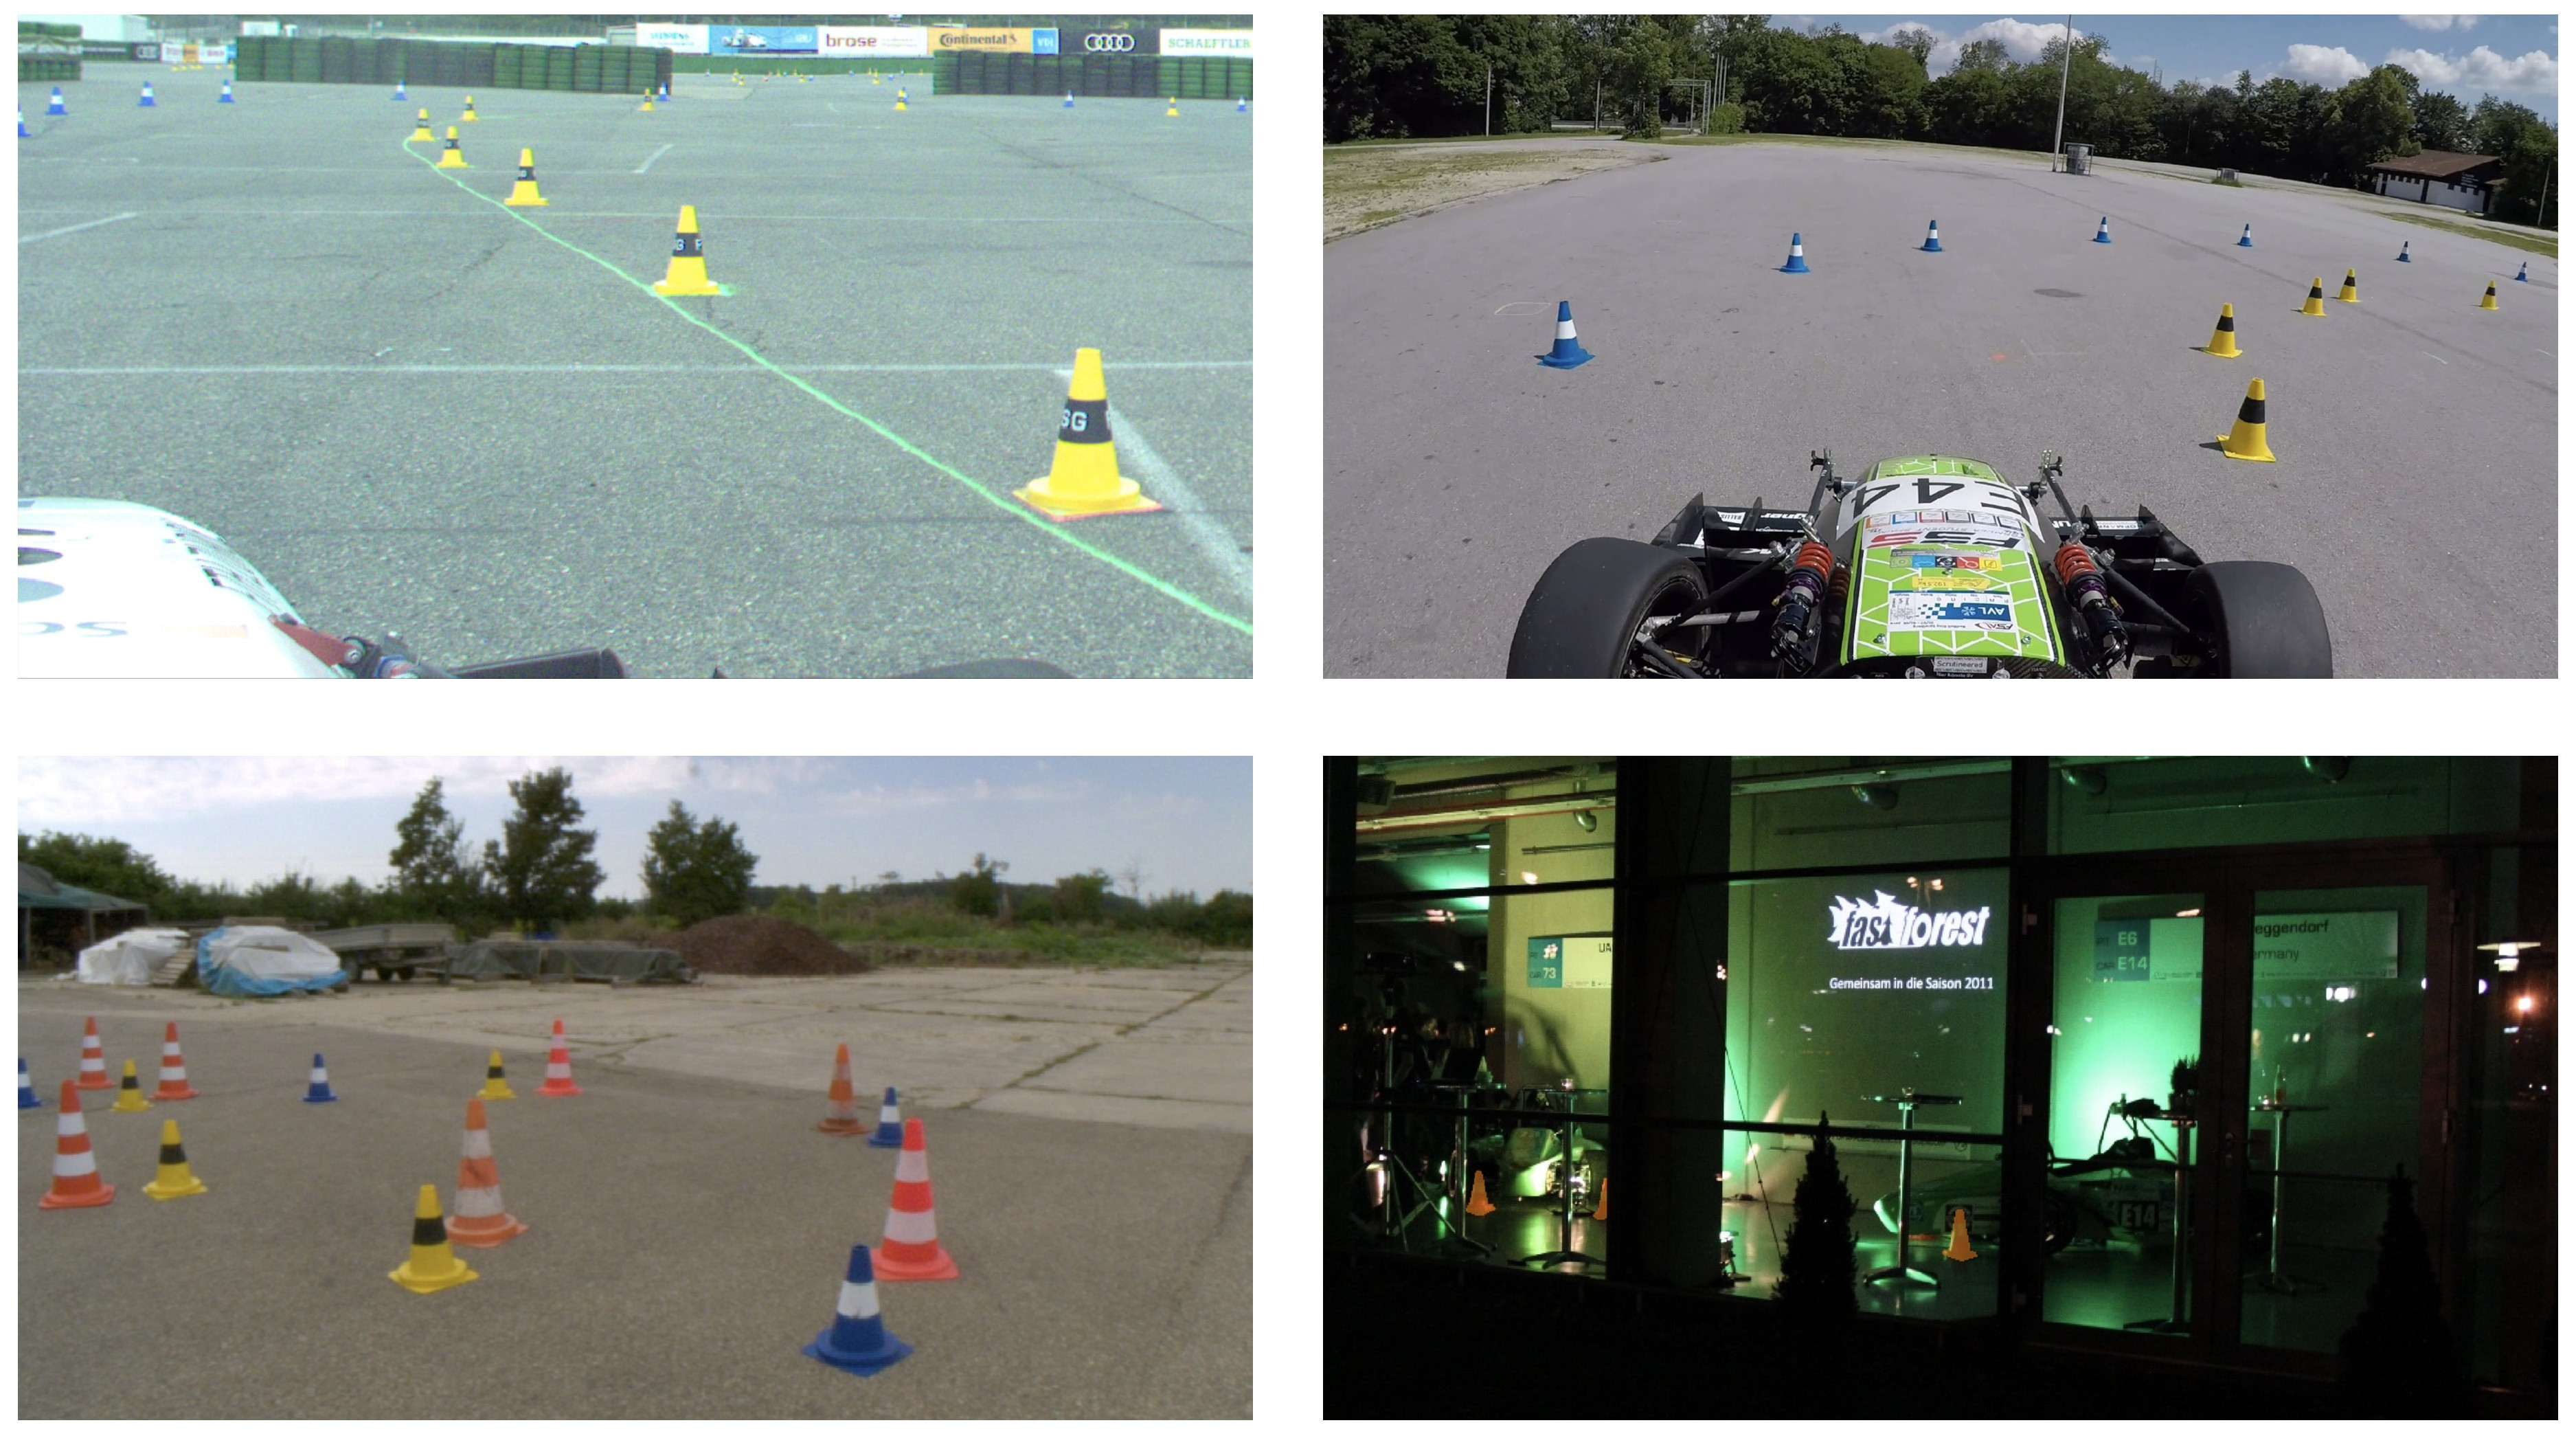
First, let’s define what exactly we want to accomplish with our training data. Generally, you want to have a training set that teaches your network to detect cones. More specifically, you want your detector to identify all the real cones while not detecting any other objects as cones. To achieve this, it is necessary to collect a wide range of training samples. Samples that show the cones in all conditions in which you want to detect them. But also backgrounds that may confuse the detector and could cause false positives.
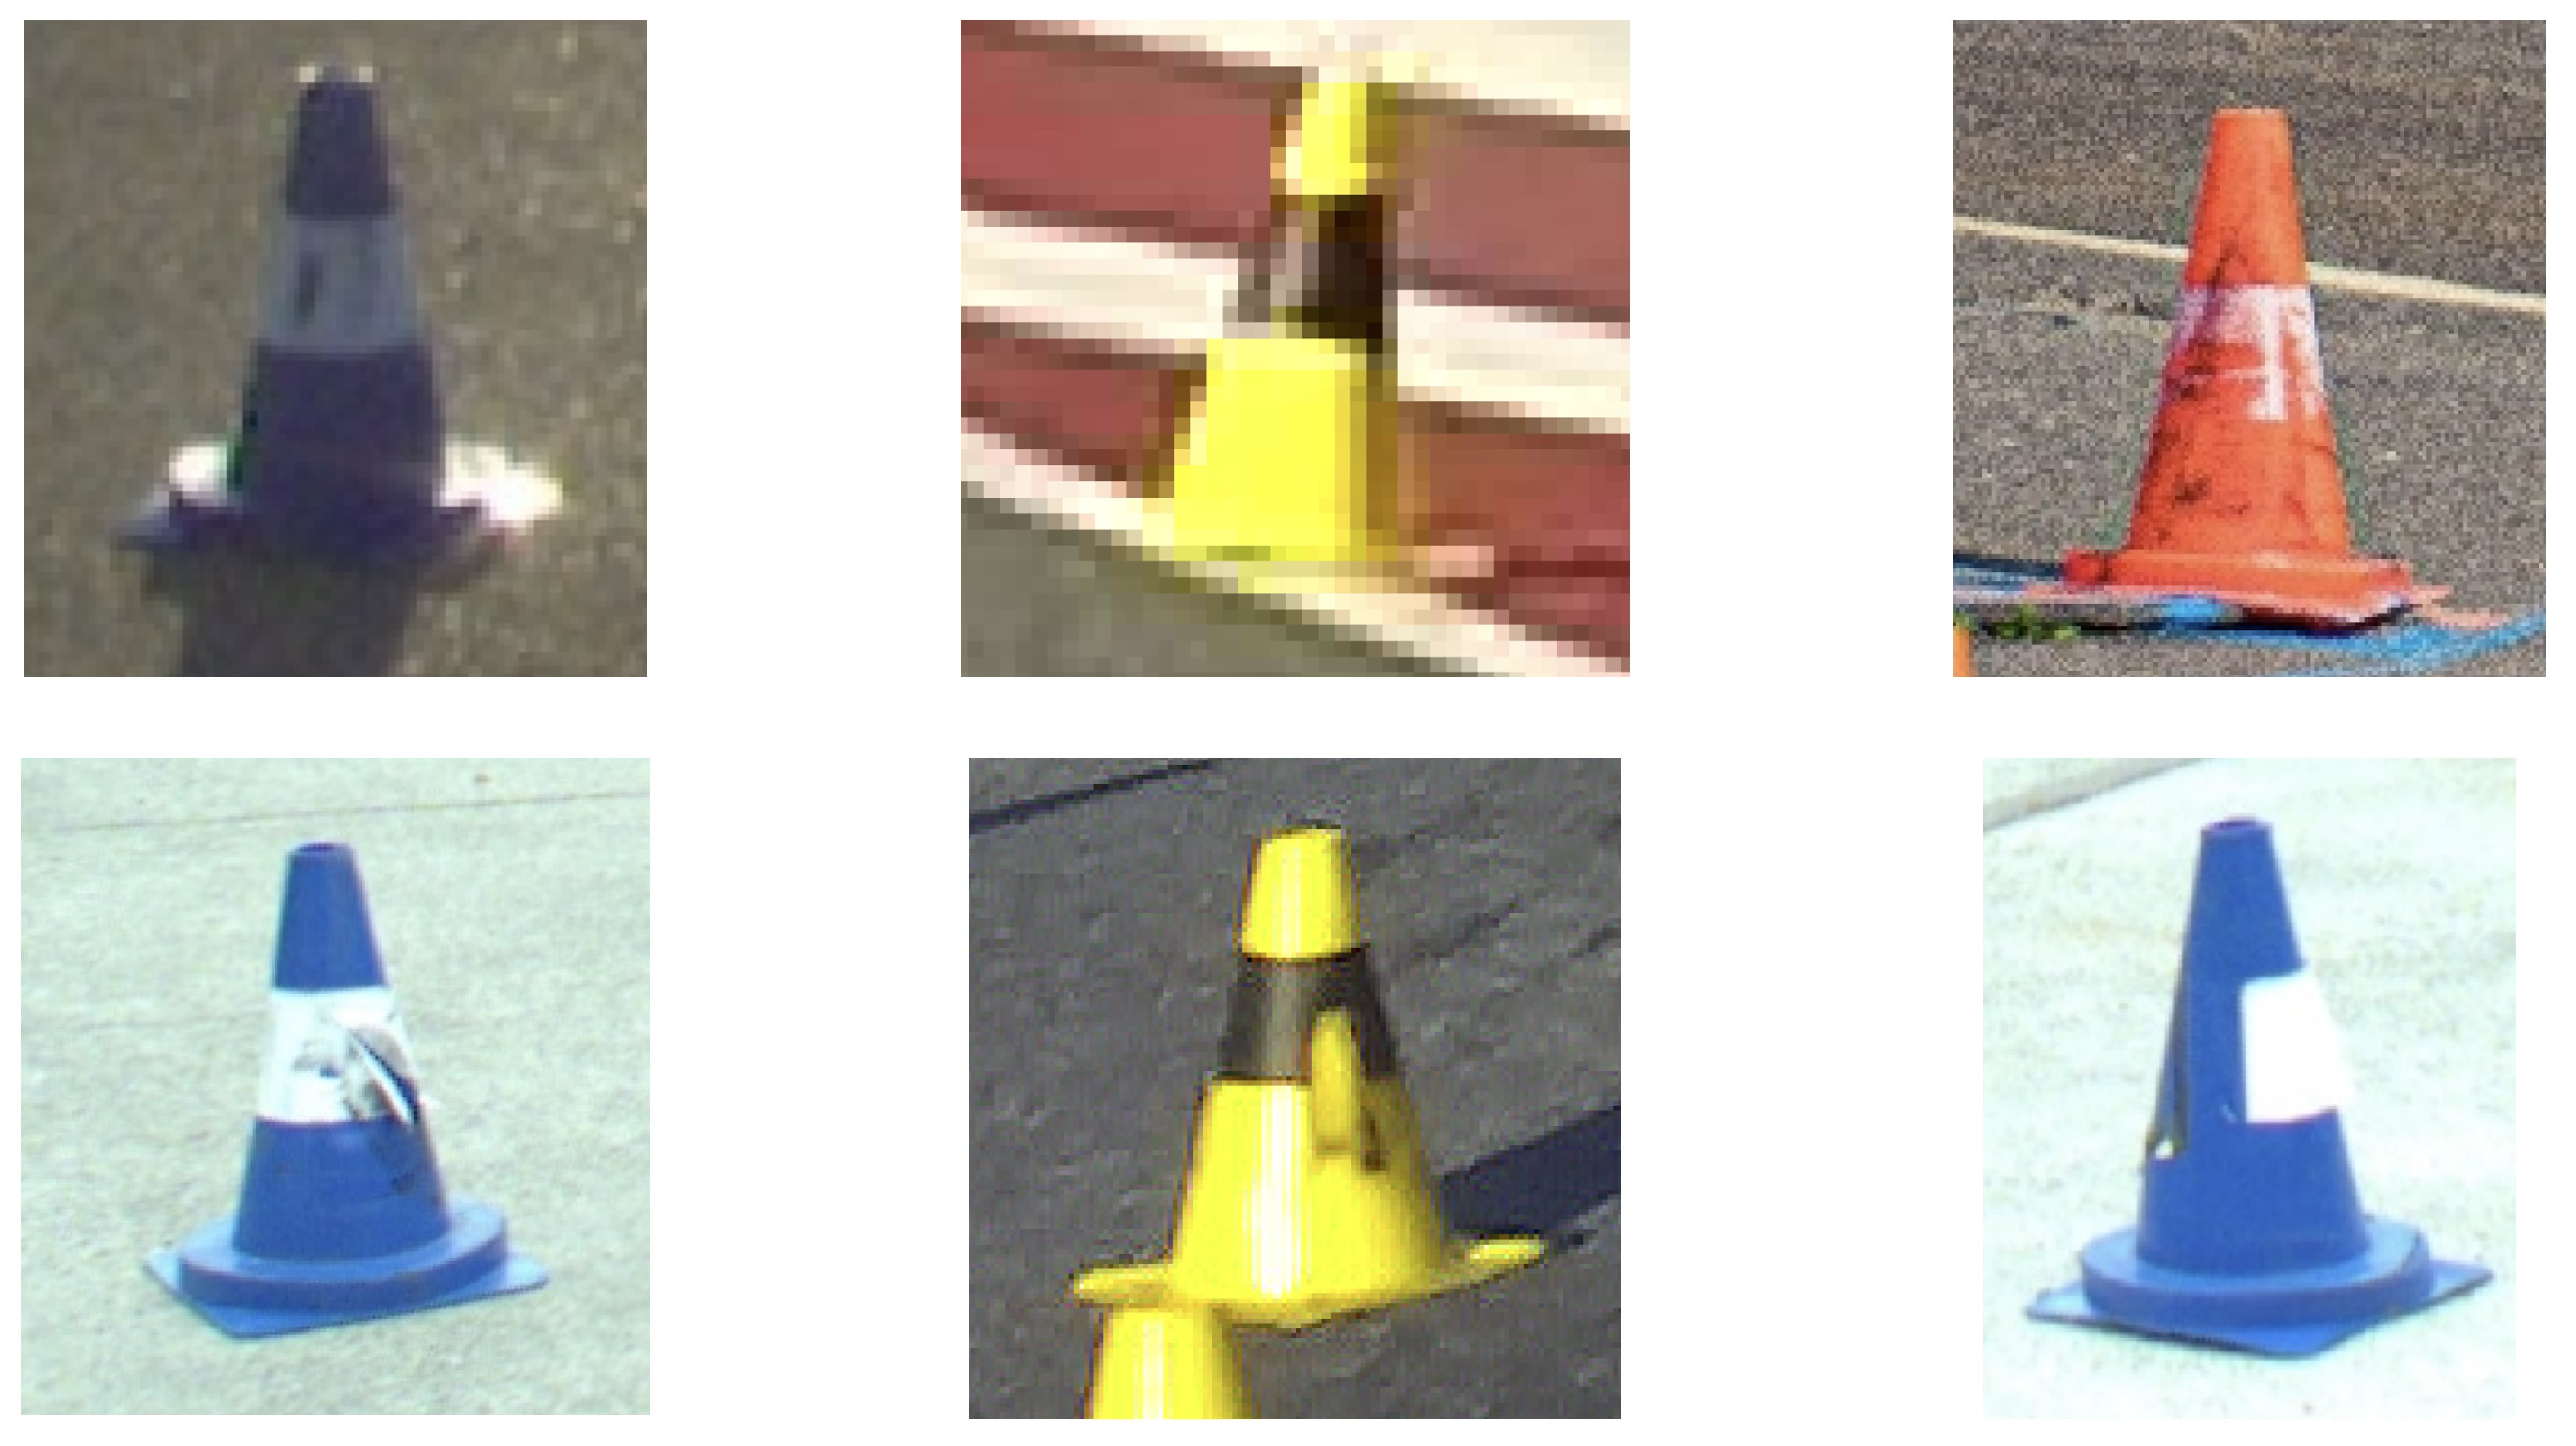
Feel free to apply some real-world data augmentation like duct-tape or moderate paint on the cones. If you only take pictures of perfect cones, your network will only learn to detect the ones in perfect condition.
Sample Distribution
The second important part besides the content of the single pictures is the composition of the whole dataset. For the latency critical application in Formula Student, you usually select a small and fast detection network. And for these small networks, the optimizer often has to weight of, for which scenarios the network will be optimized. For example, if you train your network with ten samples of a person wearing a cone as a hat and one of a valid track, the optimizer will think you want to detect cone hats.
The key here is to get a proper distribution of the samples over the whole operating range. As we want to detect the cones that mark the boundaries of a valid Formula Student Driverless track, a more significant share of the images should come from such a setup. Nevertheless, the more exotic placements of the cones improve the robustness, as they add a lot of different background features that should not be detected as cones. Just try to push the overfitting a bit more into the direction of official tracks then cone hats.
Similarity Score
Let’s assume you collected some raw data from different sources and put them into three separate folders. Now open a terminal in the parent folder and place the following command:
fsoco similarity-scorer "*/*.jpg"
This will extract a 4096 byte feature vector from all the images matching the */*.jpg glob.
The source of the feature vector is the output of a middle layer of AlexNet and is a general measure of image features.
All of the feature vectors are then compared against each other using cosine similarity.
Images with a similarity higher than 0.95 generally belong to the same data collection session.
Images with a similarity greater than 0.99 are pretty much the same.
The score of an image is the number of images that have a similarity greater than 0.95. Your total score is the average number of the per-image score.
Our example above produced the following output, where the global score is 45.14. This pretty roughly says that on average we took 45 images per session. Or if we have 450 pictures in total, the data is from ten different locations, weather or lighting conditions.
[Lower is better]

Your global score is: 45.14

....

Score per folder:
folder
event_track     68.40
test_track      54.96
workshop_test   4.55
Name: folder_Cosine_0.95, dtype: float64
You should generally aim for a global score as low as possible (10-75). But it also depends on the type of data you have. For example, if you have data from an official FSD Event you can sample the data at a rate of around 0.5 m distance traveled and have a score of 100 - 300. This also applies to valid setups on your test track. For camera footage from official events driven by a human driver (non blue/yellow track boundaries), you should aim for a score (per folder) below 40. And for all off track setups, you should definitely stay below 5.
To speed up the extraction process you can use the --gpu option (30% faster).
You can also increase the number of workers --num_workers n.
In combination with the gpu flag, you need ~1GB GPU memory per worker.
The tool creates a ‘.feature_vectors.cache’ file in the working directory, that stores a mapping from md5 file hash to feature vector.
This speeds up the process if you execute it a second time.
Display Similarity Samples
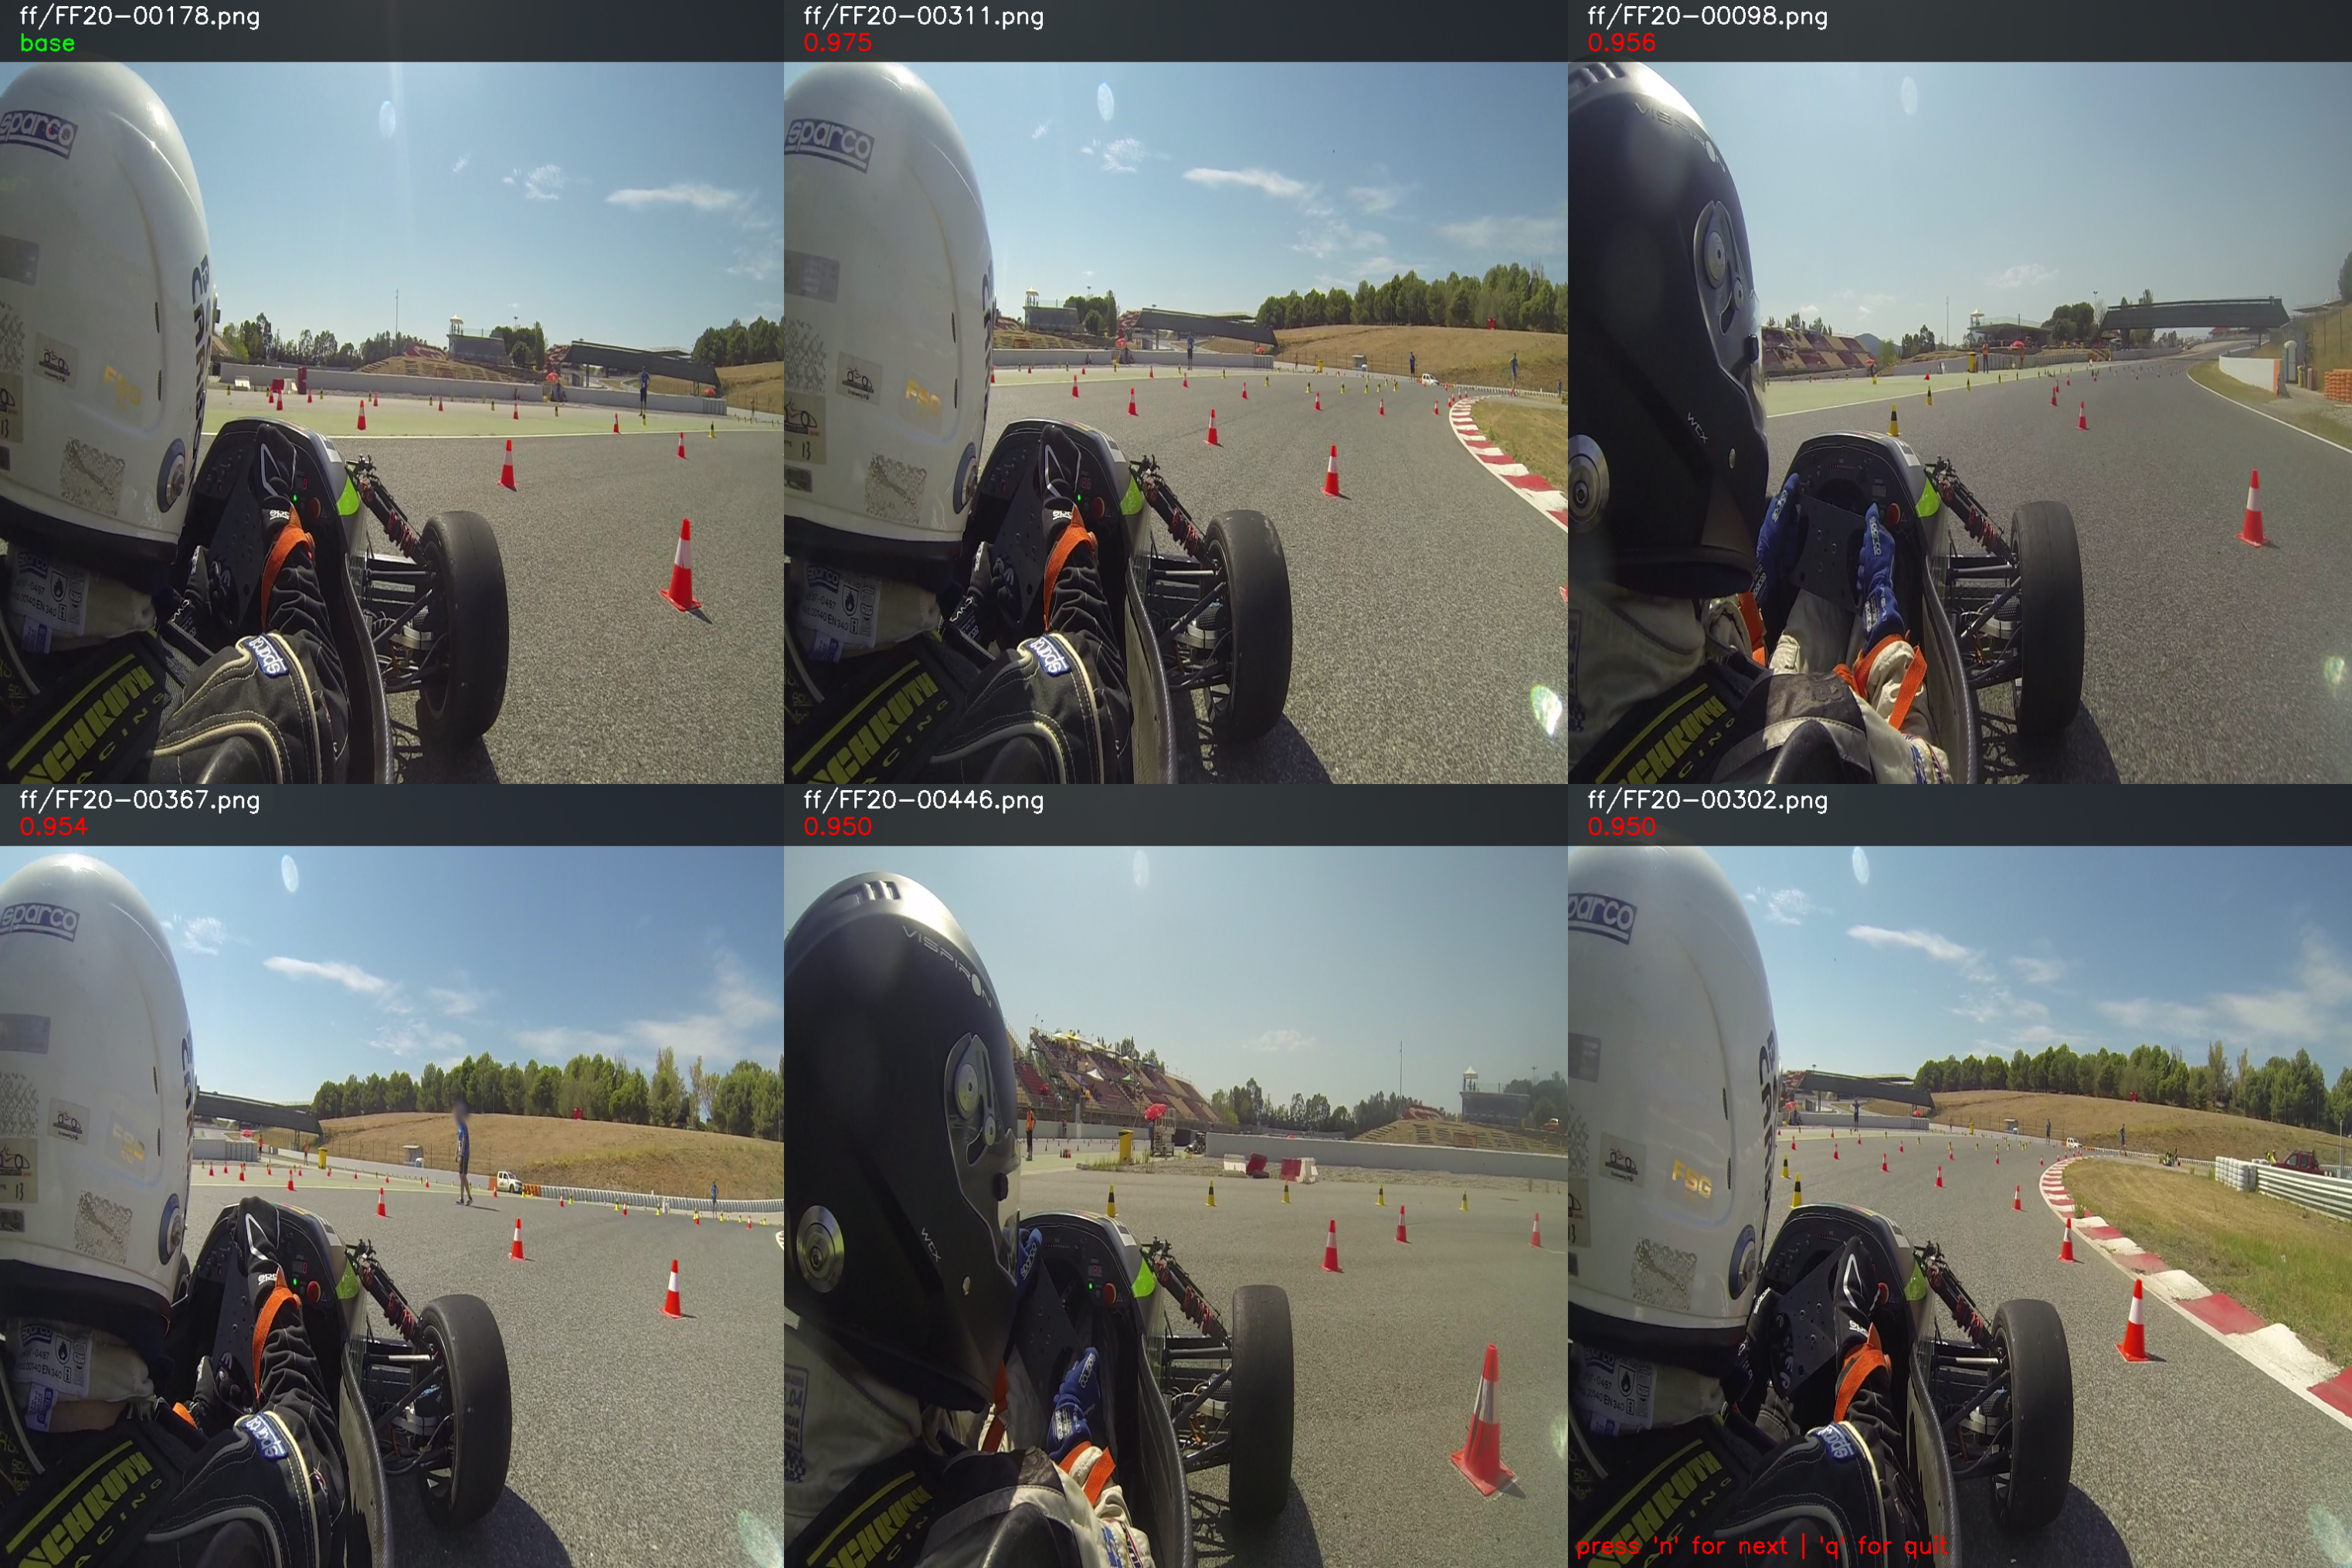
To gain a better understanding of the similarity values, you can use the --show [1-100] option,
to display for a random selection of images the top five most similar images with their cosine similarity value.
The argument specifies the percentage of images per folder to show.
Select Best Images
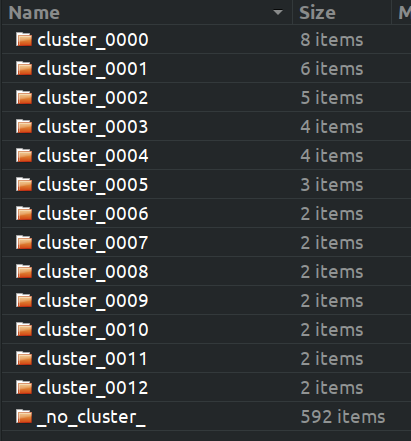
To select the best samples out of a bigger collection, you can use the --clustering_threshold [0.0-1.0] option.
This will copy all image clusters with a similarity greater than the specified threshold into separate folders under clusters.
A good threshold to start is 0.985.
There is a manual and an automated route to select the best images for labeling
The manual workflow is to create a new top-level folder with the original child folder structure. Then copy over all the images from the _no_cluster_ folder and select the best ones out of the single cluster folders. After you finished the manual selection, rerun the scorer on the new top-level folder and check your score. You may also want to copy the cache file to save recomputing the feature vectors.
There is also an automatic workflow using --auto in combination with --clustering_threshold [0.0-1.0].
For example if you use --auto --clustering_threshold 0.98 the tool will start removing images from the dataset
until there are no similarities greater than or equal to 0.98 left. The final selection is placed under [input_folder]\clusters\_auto_selection_.
But please double check the data, as the tool has only limited understanding of the real world.
The selection process can take some time, depending on the number of images.
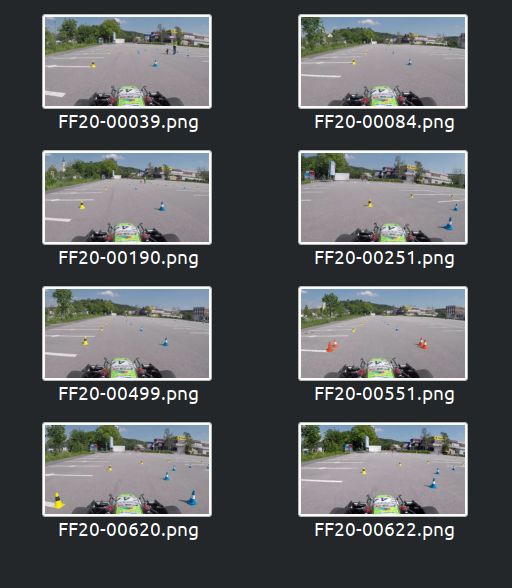
Frames extracted from the same video typically end up in one cluster.
If the video frames meet the requirements stated above (official setup, blue/yellow boundaries, sampled at 0.5m distance traveled, max one lap)
you can use the whole cluster. For non-official FSD setups, you should aim for > 15m distance traveled.
For everything else, you should be able to spot a significant difference from the file explorer thumbnail.
Favor more cones over less and small cones over big ones.
